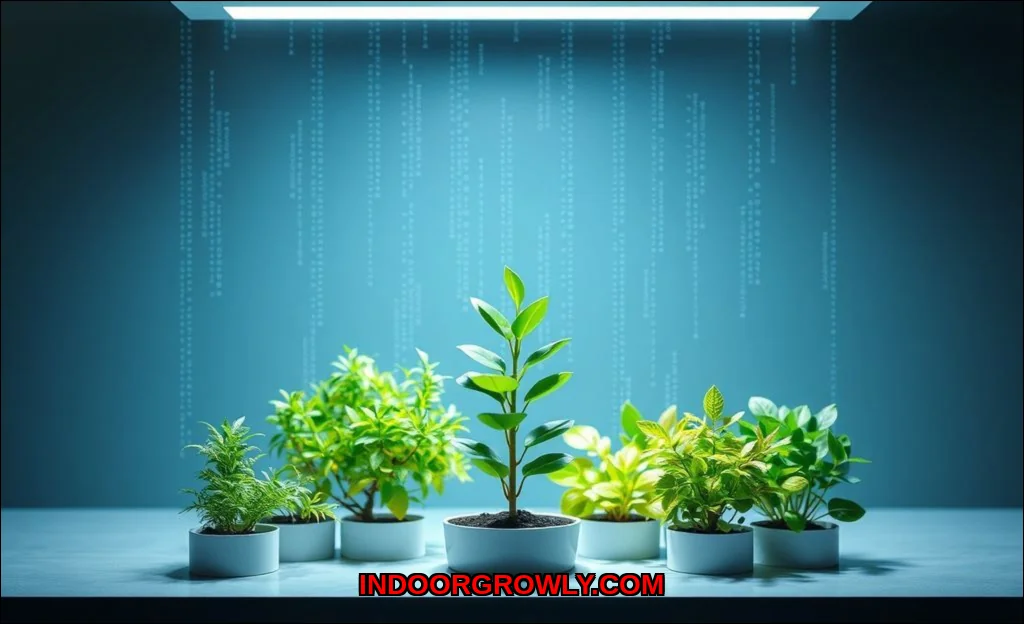
You’ve invested in a smart grow light. The app shows charts, graphs, and numbers. But what does it all mean? The data isn’t just for show; it’s a direct translation of your plants’ photosynthetic language. Interpreting it correctly moves you from guessing to knowing.
This is the core of data-driven horticulture. By analyzing the information your smart system provides, you can optimize every aspect of the environment. You’ll learn to prevent stress before it shows, accelerate growth phases, and ultimately, improve your yields. For those seeking a system that delivers this level of insight, many growers find success with the Necgemlex Smart LED, which integrates detailed metrics into a user-friendly platform.
Understanding the Core Metrics: PPFD, DLI, and Spectrum
Your smart light measures three fundamental things: light intensity, light quantity, and light quality. These are the pillars of photosynthetic efficiency.
What PPFD Data Tells You About Plant Health
PPFD (Photosynthetic Photon Flux Density) is the instantaneous intensity of usable light hitting your canopy, measured in micromoles per square meter per second (mol/m/s). Think of it as the “brightness” your plants’ photoreceptors actually use. Your light’s map shows you exactly where the light is strong and where it’s weak.
- Too Low: Growth becomes leggy and stretched as plants reach for light. Your growth rate correlation will show a direct slowdown.
- Too High: You risk photoinhibition. Leaves may bleach, curl, or show signs of light stress. The data reveals the upper limit for your specific crop.
This is where PAR measurements become actionable. By adjusting height and intensity based on PPFD maps, you ensure every leaf gets the energy it needs without waste.
The Critical Role of DLI Tracking
While PPFD is a snapshot, DLI (Daily Light Integral) is the day’s total dose. It’s the sum of all photosynthetic photon flux over your photoperiod. DLI is arguably the single most important number for steady growth. An expert insight holds true: consistent DLI is more critical than peak PPFD. A plant can handle high intensity if its daily “meal” of light is correct and consistent.
Your smart system’s DLI tracking automates this calculation. You set a target DLI (e.g., 20 mol/m/day for flowering tomatoes), and the light can adjust its output or runtime to hit that target, even compensating for lamp aging or canopy height changes.
Light Spectrum Analysis for Plant Steering
Advanced smart lights let you adjust spectral channels. The data from these adjustments is powerful. Plants use different photoreceptors like phytochrome and cryptochrome to sense light quality.
- Blue-heavy spectra promote compact, vegetative growth.
- Increased far-red (around 730nm) can trigger the shade-avoidance response, stretching stemsuseful for certain training techniques.
This is the essence of crop steering. By analyzing how light spectrum data affects internodal spacing and flowering triggers, you can manipulate plant architecture. As one expert insight notes, correlating far-red ratios with flowering time allows for precise steering without chemicals. You’re not just providing light; you’re sending specific growth instructions.
Environmental Correlation: Temperature, Humidity, and VPD
Light data in a vacuum is incomplete. Your plants’ response to light is dictated by their environment. This is where integrated environmental sensors create a complete picture.
Why VPD Monitoring is a Game-Changer
VPD (Vapor Pressure Deficit) measures the “thirst” of the air. It’s the difference between the moisture in the leaf and the moisture in the air. It directly controls the transpiration rate, which is the engine for nutrient uptake.
Your data logger should chart VPD alongside light levels. You’ll see a clear pattern:
- If VPD is too low (high humidity), transpiration stalls. Nutrients don’t move effectively, even with perfect light.
- If VPD is too high (low humidity), plants close stomata to conserve water, shutting down photosynthesis and causing stress.
Optimizing VPD monitoring for each growth stage ensures your plants can fully utilize the light you’re providing. It’s the link between environment and metabolism.
Correlating Environmental Data with Growth Rates
This is where you become a plant detective. Look at your growth logs. Then, look back at your environmental charts for the preceding week.
Was there a spike in temperature that coincided with a slowdown? Did a drop in humidity (high VPD) cause leaf curl right as the lights peaked? By correlating environmental data with growth rates, you identify limiting factors. The light data might be perfect, but if the environment is off, the plant can’t use it. This holistic view is central to Controlled Environment Agriculture (CEA).
Growth Stage Optimization Through Data Patterns
Smart lights allow you to create and deploy light recipes: preset combinations of intensity, spectrum, and photoperiod for each phase of growth.
Vegetative vs. Flowering: A Data-Driven Shift
The data reveals clear needs. In veg, plants often thrive under a higher blue ratio and a moderate DLI (e.g., 15-20 mol/m/day). Your goal is building robust structure. In flowering or fruiting, the demand for photons skyrockets. Plants typically need a higher DLI (e.g., 20-30+ mol/m/day) and a spectrum richer in red and far-red to encourage reproductive development.
Your system’s photoperiod optimization is automatic, but the fine-tuning isn’t. By reviewing growth rate correlation data after changing a recipe, you see what works. You learn, for example, that your basil clones root faster with 10% more blue, or your peppers set more fruit with a specific end-of-day far-red pulse.
Automation and Crop Steering
With proven recipes, you automate not just the on/off cycle, but the entire light environment’s evolution. This is advanced crop steering. You program gradual DLI increases, spectral shifts, and even adjust light schedules to simulate seasonal changes. The system executes consistently, removing human error and allowing you to focus on other variables. For a deeper dive into how these automated curves work, explore our analysis on what smart grow lights reveal about optimal growth curves.
Troubleshooting and Predictive Insights
The historical data from your smart system is a diagnostic treasure trove. It turns reaction into prediction.
Diagnosing Problems with Historical Data
A plant shows a deficiency. Instead of guessing at nutrients, first check your environmental logs. A period of low VPD (high humidity) could have caused calcium uptake issues, presenting as a deficiency. A spike in PPFD might have caused light burn that looks like nutrient burn. The data timeline helps you pinpoint the true cause, which is often environmental stress triggered by a light event.
Moving Towards Yield Prediction
This is the frontier. By consistently tracking DLI, VPD, and spectrum against your final harvest weights, you build a model. You start to see that a cumulative DLI of X, maintained at a VPD of Y during flowering, reliably produces Z grams per plant. This yield prediction becomes possible. It transforms your operation from art to a repeatable science. Understanding these limits is key, as discussed in our article on what smart grow lights indicate about plant adaptation limits.
Implementing Data-Driven Decisions
Knowledge is useless without action. Heres how to start using your data today.
- Benchmark: Run a standard light recipe for a full cycle and record all data and final results. This is your baseline.
- Isolate One Variable: Change one thing. Increase DLI by 10% in the next cycle, or adjust the blue/red ratio. Keep everything else identical.
- Measure the Correlation: Compare growth rates, node spacing, and final yield to your baseline. Did the change help or hurt?
- Build Your Recipe: Incorporate successful changes into your permanent light plans for that crop.
Use tools like data logging software to track these experiments. Resources from institutions like the Penn State Extension on lighting for indoor plant production or peer-reviewed studies on platforms like Frontiers in Plant Science can provide valuable scientific context for your observations.
The Tools You Need
To fully engage in this, ensure your toolkit includes:
- A smart light with adjustable spectrum and intensity output.
- An environmental controller that logs temperature, humidity, and preferably calculates VPD.
- A method to track plant growth (height, node count, dry weight).
The numbers on your screen are a conversation. Your plants are telling you what they need, what they’re suffering from, and what makes them thrive. By learning to interpret PPFD data, respecting the DLI, and correlating it all with VPD and temperature, you stop working against nature and start working with it. You shift from a gardener to a grower, from intuition to intelligence. Start small. Pick one metric, understand it, and act on it. The data is waiting.